Please consider reviewing the background materials found on this page. The information pertaining to Lake Champlain and climate change can be used to relate your intervention(s) to the impacts and challenges the Lake Champlain Basin is facing. If possible, refer to the kinds of impacts that your intervention addresses.
REGIONAL RESOURCES TO CLIMATE CHANGE
Below is a list of links to useful resources relating to Climate Change in the Lake Champlain Basin
Participants in this crowdsourcing effort are encouraged to recommend additional resources to add to this list. Make these recommendations on the "Additional Resources" discussion thread off of the General Discussion tab.
Climate
Change Projections in the Lake Champlain Basin Region
Figures from, "IMPACTS OF PROJECTED CLIMATE CHANGE OVER THE LAKE
CHAMPLAIN BASIN IN VERMONT" by Justin Guilbert, Brian Beckage, Jonathan M. Winter, Radley M. Horton, Timothy Perkins
and Arne Bomblies. 2014
Under review at the American Meteorological Society's
Journal of Applied Meteorology and Climatology.
Abstract:
The Lake Champlain Basin is a critical ecological and socioeconomic resource of the Northeastern US and Southern Quebec. While general circulation models (GCMs) provide an overview of climate change in the region, they lack the spatial and temporal resolution necessary to fully anticipate the effects of rising global temperatures associated with increasing greenhouse gas concentrations. Observed trends in precipitation and temperature were assessed across the Lake Champlain Basin to bridge the gap between global climate change and local impacts. Future shifts in precipitation and temperature were evaluated as well as derived indices, including maple syrup production, days above 90 degrees Fahrenheit, and snowfall, relevant to managing the natural and human environments in the region. Four statistically downscaled, bias-corrected GCM simulations were evaluated from the Coupled Model Intercomparison Project Phase 5 (CMIP5) forced by two Representative Concentrations Pathways (RCPs) to sample the uncertainty in future climate simulations. Daily precipitation is projected to increase between 0.82% and 1.17% per decade during the 21st century while daily temperature is projected to increase between 0.43 and 0.49 degrees Celsius per decade. Annual snowfall at six major ski resorts in the region is projected to decrease between 46.9% and 52.4% by late-century. In the month of July, the number of days above 90 degrees Fahrenheit in Burlington, Vermont is projected to increase by over 10 days during the 21st century.
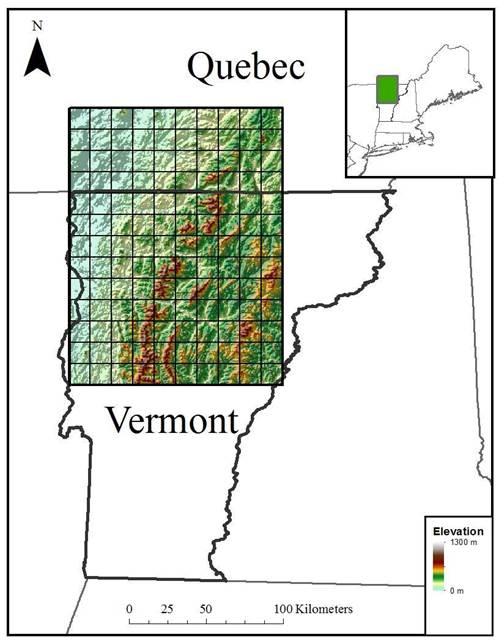
Fig. 1Study region including northern Vermont and southern Quebec, with Lake
Champlain and the Champlain Valley bordering the western edge of the study
region and the Green Mountains across the eastern portion of the study region. Eighth
degree grid boxes are included to show the resolution of the Bias-Correction
Constructed Analogues data.
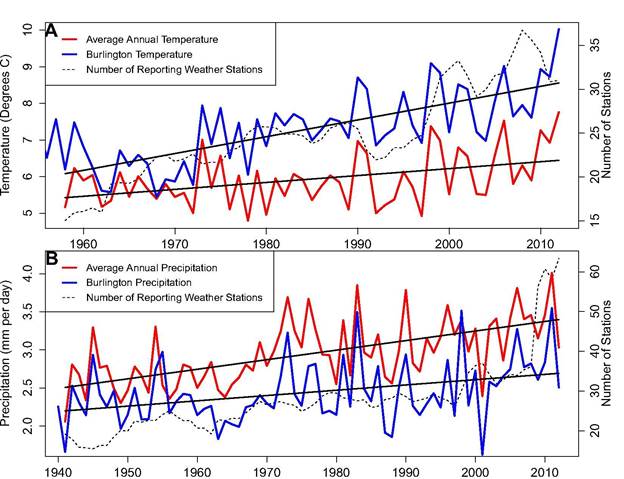
Fig. 2Historic trends in A) temperature
and B) precipitation from weather stations across the study region aggregated
to yearly averages. The dotted black lines indicate the number of weather
stations that are reporting temperature or precipitation values. We selected
1958 and 1941 as the beginning of the historical period for temperature and
precipitation, respectively, because these were the first years with 15 or more
weather stations reporting temperature or precipitation. The solid black line
is the linear regression line showing the increase in temperature from 1958 to
2012, with the slope indicating an increase of 0.19 degrees Celsius per decade
and 0.12 mm per day per decade. Each weather station was weighted equally with
no attention to spatial or topographical distributions.
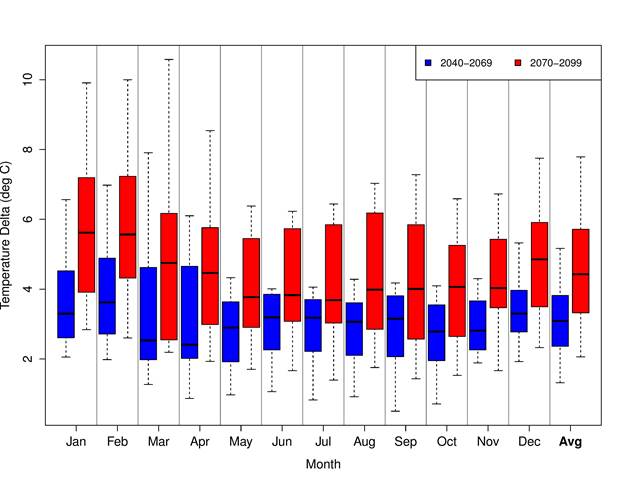
Fig. 3Projected increases in A) mean temperature and B) the 0.05 and 0.95
quantiles for 2040-2069 and 2070-2099 for RCP 4.5 and 8.5 compared to the
1970-1999 base period and 3 GCMs. The 0.05 quantile is representative of the
coldest days of a month and the 0.95 quantile is representative of the warmest
days of a month. The furthest right column shows the average annual temperature
change for mean, and 0.05 and 0.95 quantiles. The summer months, June through
August, are projected to generally warm less than months in other seasons.
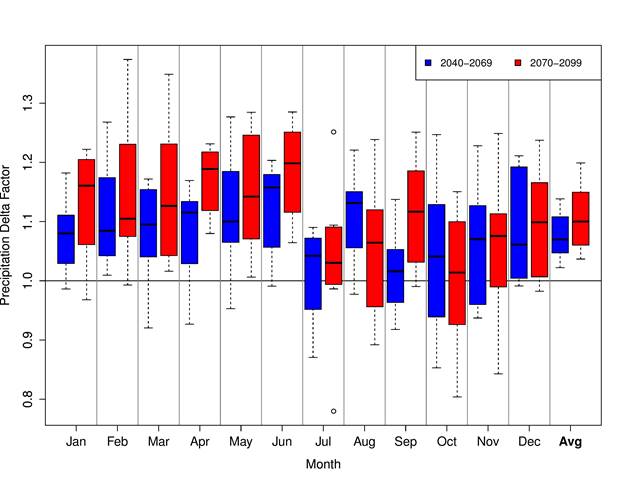
Fig. 4Projected increases in A) mean
and B) the 0.95 and 0.99 quantiles of daily precipitation for 2040-2069 and
2070-2099 for RCP 4.5 and 8.5 compared to the 1970-1999 base period and 3 GCMs.
Precipitation delta factors above 1.0 indicate that the intensity of a
precipitation event is expected to increase. There is large uncertainty in the
precipitation projections: Precipitation change for July in the period
2070-2099, for example, varies from a ~25% increase to a ~22% decrease in daily
rainfall. The choice of GCM often has a
greater influence than the climate scenario, for example, in October where both
the minimum and maximum change in mean precipitation occurs in the same
scenario run by two different GCMs. The two quantiles shown are representative
of the upper tail of a daily precipitation distribution. Nearly all delta factors averaged across the
year show an increase in large (0.95) daily precipitation events for both
future periods while all delta factors averaged across the year for the largest
(0.99) daily precipitation events are above 1.0.
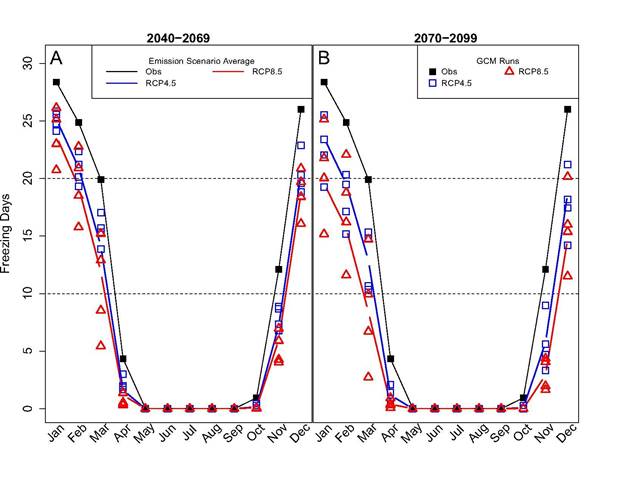
Fig. 5The projected number of freezing
days per month for A) 2040-2069 and B) 2070-2099 for RCP 4.5 and 8.5 compared
to the 1970-1999 base period. Freezing days were defined as days with an
average temperature below 0o C. The number of mid-winter, December through February, thaws in the study
area will increase as the number of freezing days decreases.
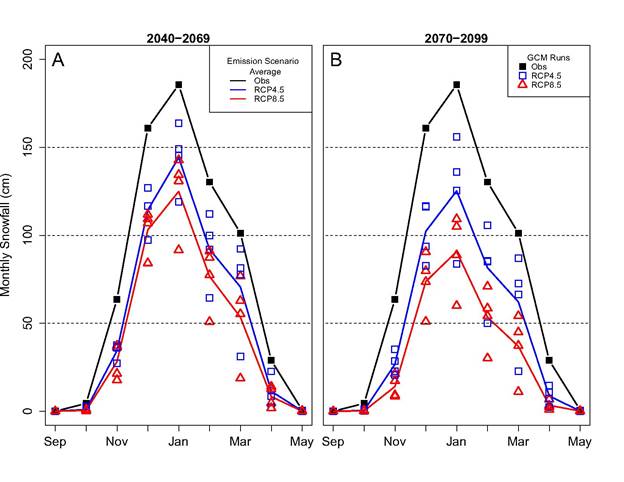
Fig. 6The projected monthly snowfall
for A) 2040-2069 and B) 2070-2099 for RCP 4.5 and 8.5 compared to the 1970-1999
base period. Monthly snowfall shows a decreasing trend with time across the
three emissions scenarios. All months show decreases in snowfall for both time
periods and all scenarios. By late
century, a 42 percent decrease in January snowfall is projected in comparison
to the observational period.
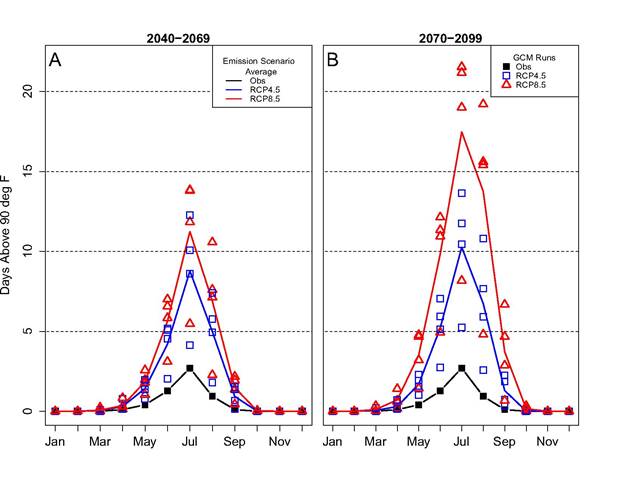
Fig. 7The projected number of 'hot'
days above 90 degrees F for 2040-2069 and 2070-2099 for RCP 4.5 and 8.5
compared to the 1970-1999 base period. The
number of hot days per year increases by 18.6 and 31.9 days by 2040-2069 and
2070-2099 with increases in July accounting for 7.3 and 11.2 days per year
respectively.
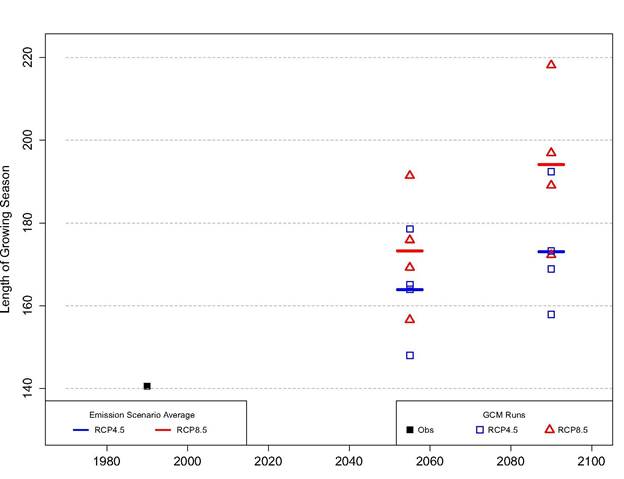
Fig. 8The projected growing season
length for 2040-2069 and 2070-2099 for RCP 4.5 and 8.5 compared to the
1970-1999 base period. The growing
season length increases by 23.4 and 32.5 days by 2040-2069 and 2070-2099 under
RCP 4.5 and by 32.8 and 53.6 days under RCP 8.5.
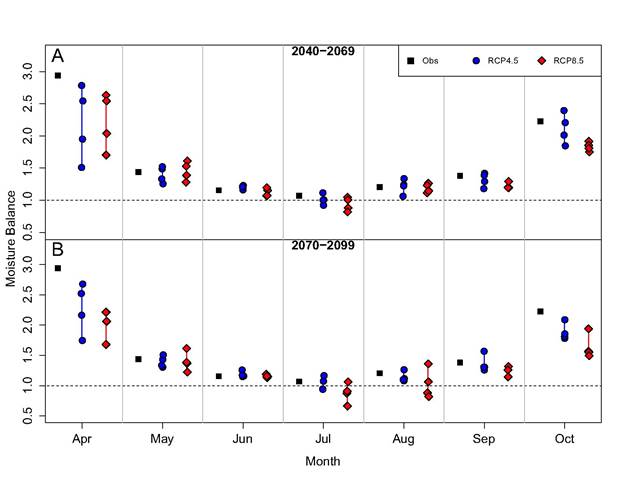
Fig. 9Projected moisture balance for A) 2040-2069 and B) 2070-2099 for RCP 4.
and 8.5 compared to the 1970-1999 base period. Projected future moisture
balance usually brackets historic moisture balance indicating uncertainty in
moisture balance projections.
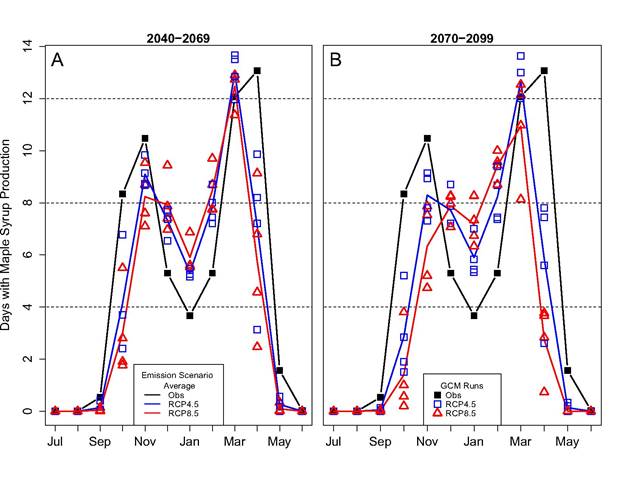
Fig. 10Projected days with maple syrup production for A) 2040-2069 and B) 2070-2099 for
RCP 4.5 and 8.5 compared to the 1970-1999 base period. Days with maple syrup
production are projected to shift from 2 distinct peaks in fall and spring
towards one peak in mid-winter. The number of days suitable for maple syrup
production is expected to decrease by 7.3 and 11.5 days per year by mid- and
late century.
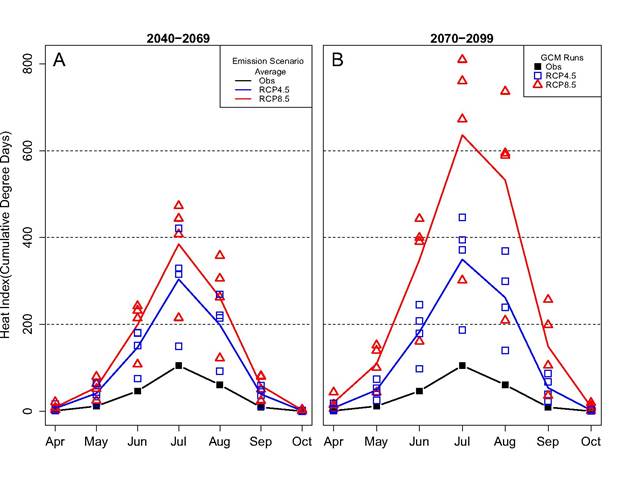
Fig. 11Projected heat index
for A) 2040-2069 and
B) 2070-2099 for RCP 4.5 and 8.5 compared to the 1970-1999 base period. In
degree days the annual heat index is expected to increase by over 600 and 1100
degree days by mid- and late century respectively.
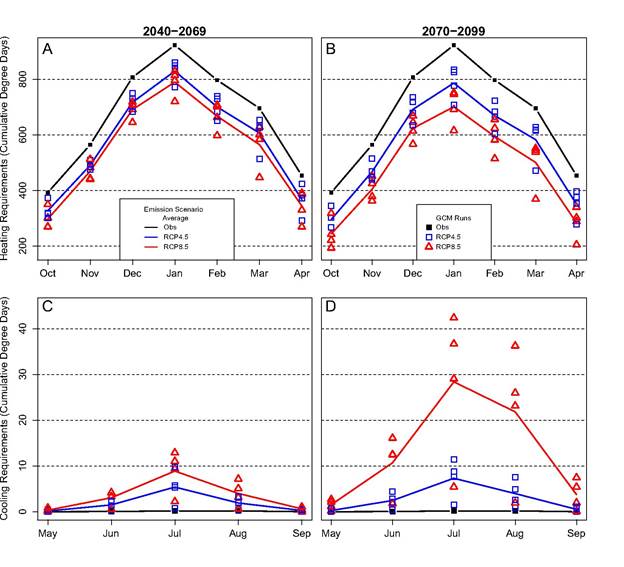
Fig. 12.
Projected heating
and cooling requirements for A) 2040-2069 and B) 2070-2099 for RCP 4.5 and 8.5 compared to the
1970-1999 base period. The degree days of cooling are expected to increase by
12.7 and 40.0 while the degree days of heating are projected to decrease by 987
and 1409 by mid- and late century respectively.
HISTORICAL TRENDS
Figures from, "The Vermont Climate Assessment" by Galford, G., Carlson, S., Ford, S., Hoogenboom, A., Nash, J., Palchak, E., Pears, S., Underwood, K. Baker, D. 2014
Climate Paper Galford, G., Hadnott, B, et. al In Prep.
Data retrieved from NOAA's Applied Climate Information System
STAKEHOLDER GENERATED CLIMATE IMPACTS
Introduction to Climate Change Impact Scenario Map
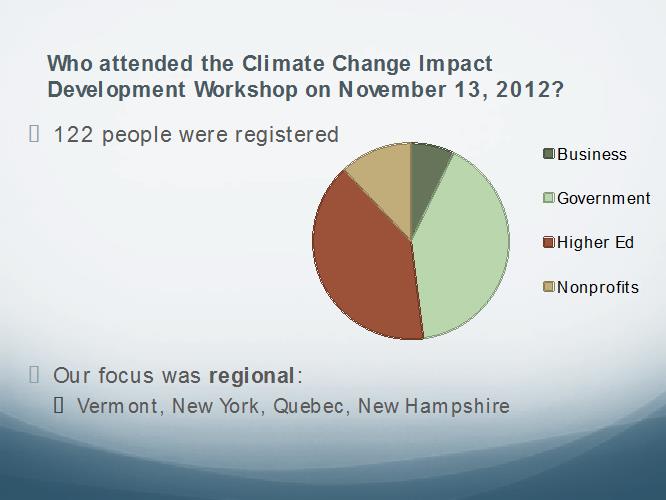
The maps in this section were developed from the work of a day-long workshop, held on November 13, 2012 in Burlington, Vermont's Sheraton Hotel. The workshop's 122 participants were asked to brainstorm sets of climate change effects and the possible cascading impacts, extending through first, second, and third orders, resulting from those effects. Workshop participants included people from business, government, higher education and nonprofits (see fig.1). The network map shows the presumed links between impact categories that were crowdsourced during this workshop.
Fig. 1: Breakdown of Participants at the November
13, 2012 Climate Change Impact Scenario workshop
Workshop participants were introduced to the following set of assumptions about the causes and effects of climate impacts:
The effects of climate change both within and external to Vermont and the North Country, ...
have impacts across a wide array of domains, including agriculture, the environment, the economy, infrastructure, and public health and safety...
and these impacts likely extend into more than one domain ...
these impacts, in turn, can lead to an array of other secondary consequences.
Anticipating how causes and effects are linked allows us to generate proactive responses to changing conditions and extreme events.
Your participation in this online Delphi survey is designed to identify and evaluate these proactive responses.
The range of possible effects of climate change included change in seasonal precipitation, increased flooding, increased temperatures, and changes in snow and ice cover. Secondary consequences, such as mass population migration and economic decline were also considered and many others.
The protocol used during the afternoon of the workshop was staged in three parts:
PART 1:
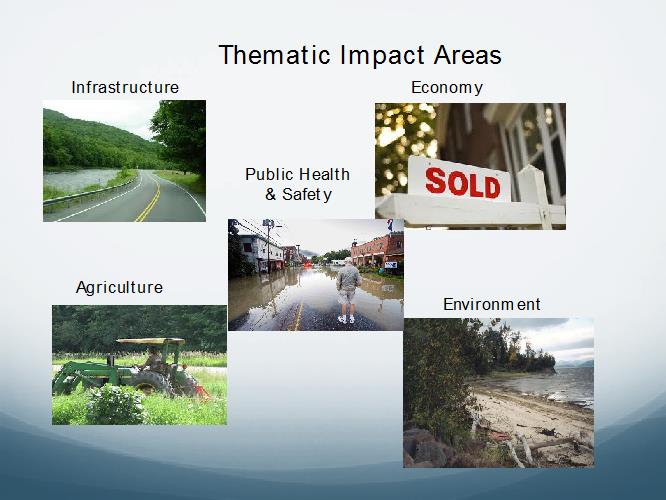
Workshop participants were divided into five different working group areas: Environment, Agriculture, Economy, Infrastructure, and Public Health & Safety. During the first phase of the workshop each group considered the range of climate change effects that may impact their category. A list of 1st order impact categories was generated to show the impacts that the effects of climate change would produce (fig. 2).
Fig. 2: Thematic Impact Areas Used in the November 13, 2012 Climate Change Impact Scenario Workshop
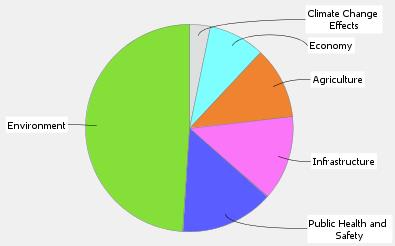
The figure (fig. 3) below provides a breakdown of the total number of nodes from each of these thematic areas that appears in the final analysis.
PART 2:
Groups were then mixed. People were randomly assigned to a different impact category. Reviewing the list generated by the first group, 2nd and 3rd order impact categories were generated to show what impacts the first order impacts would, in turn, create or lead to.
PART 3:
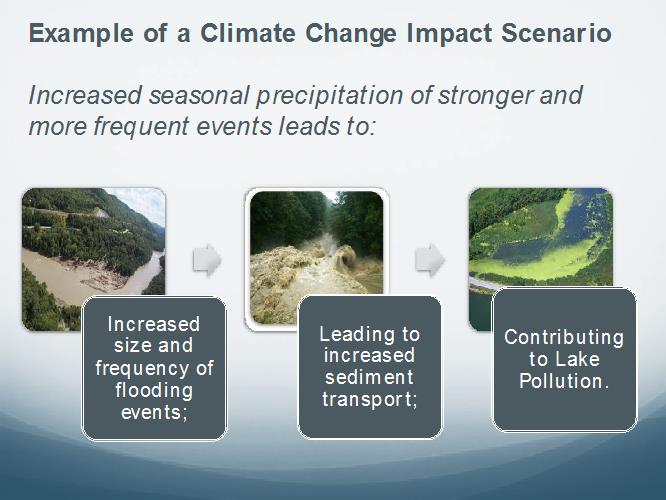
The original groups from PART 1 reconvened and reviewed the work of the previous group. Impact scenarios, representing chains of climate change effects and their resultant 1st, 2nd and 3rd order impacts, were discussed and refined. More consequential and viable scenarios were to be highlighted. Figure 4 below illustrates how these causal chains were to be outlined.
Fig. 4: Example of Climate Change Impact Scenario
At the conclusion of this workshop over 1,500 impact scenarios (sets of at least three impacts) were generated and compiled into a comprehensive database. RACC researchers proceeded to analyze this database, sometime collapsing impact categories and weeding out implausible casual relationships. Following this process, about 950 impact scenarios remained.
In order to identify those impact scenarios with the greatest impact on water quality, a core aim of the RACC project, a key word search for 25 different water quality related terms was conducted. Only those impact scenarios with at least one of these key words in them were selected. A final set of 295 scenarios was obtained.
Treating each impact category as a node and the transitions from the climate change effects to the first order impact, and then subsequently onto the later ordered impacts, in order, generated the network of impacts below. It was then analyzed using network analytic tools ORA, UCINet and Gephi.
The network shows how the previously identified impact scenarios interact, generating new causal pathways and allowing for impact scenarios to initiate new impact scenarios. This process formulates new pathways and shows how impacts can both be generated from multiple sources and have multiple impacts.
Larger nodes in the network sit along a greater number of the most efficient pathways through the network. Nodes are colored for their thematic impact area and ties are colored for the thematic impact area of the node to which they point, matching the colors for each thematic impact area in Figure 3.
The creators of this map want to underscore that the assumptions regarding cause and effect were generated by the 122 participants in the first workshop. Although we tried to remove implausible correlations and impact category redundancies, we likely missed some. We welcome comments that point out these errors and help us to refine this model of the system. See below on how to comment on the map.
This map of possible impacts is incomplete. It reflects the thoughts and areas of concern/focus of the participants in the workshop at the time.
Comment on the map:
We invite Delphi participants to comment on this map. Tell us where the links are wrong. Explain what is missing. We will continue to modify this map and look to eventually tie each presumed causal link to what is known, scientifically, regarding each dynamic relationship. We believe this concept map is first of its kind to be generated through an extensive stakeholder engagement process.
How to use this map:
Despite its limitations the concept map is still useful in portraying complex interdependent casual relationships across many domains. We ask that you take some time scanning it and see where you believe to be the major driving impact areas in the system.
We encourage you to use this map to inspire ideas about your adaptive interventions. If this makes sense to you, refer to this map or the relevant impact categories in your rationale, your comments about other people's interventions, and contributions to discussion threads.